I had this data visualization idea that I can show in a small screen and maybe stick on a wall as a nice installation andthe Raspberry platform was perfect for that.
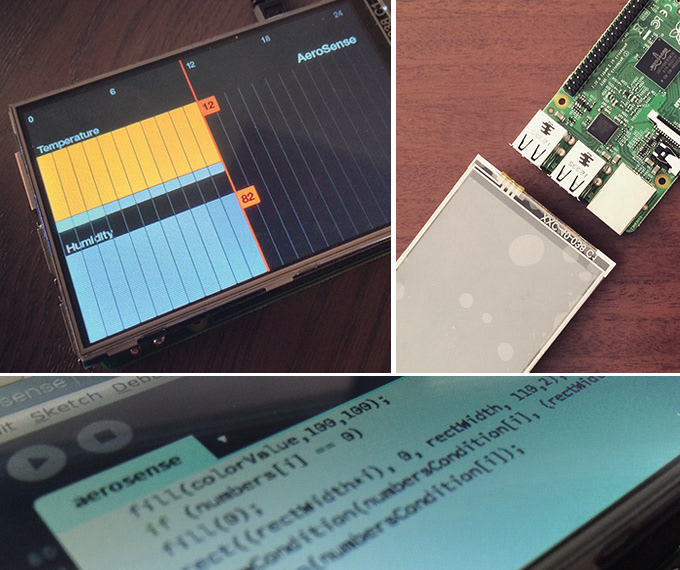
I didn't have a spare keyboard and a mouse at the time so I couldn't hook the Pi to a monitor so I had to do the coding on a PC then transfer it to the Pi. Surprisingly the process was dead easy and the Raspbian P5 compiled it without any
problems.
I've took the example Yahoo XML code as the basis of the program and added the graphical elements.
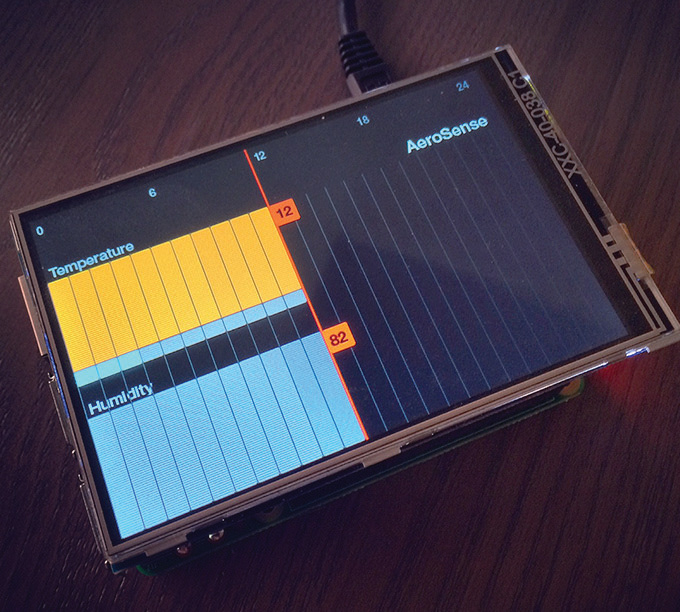
The results were satisfying! The top row shows the temperature with the sky conditions (clear, clouded, rainy) while the bottom one represents the barometric pressure. It's not bug free of course, but it was a nice prototype which open door to other possibilities for me.